Presented today in Milan, hosted by Borsa Italiana, the “Fintech M&As Study” realized by Mind the Bridge in collaboration with L’Atelier BNP-Paribas Americas. Based on the “Tech Startup M&As: 2018 Report” published in 2018 with Crunchbase, the study focuses on M&As in the global Fintech scene, covering today a wide range of solutions, from lending to saving, personal and institutional investments, equity financing, consumer banking, and more.
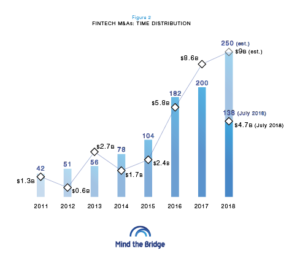
The Report shows a continuous growing path in the Fintech M&As in the past 8 years with a peak between 2015 and 2016, where the deal number almost doubled and the total deal value was increased by 2.4 times. For 2018 we are looking at around 250 M&A transactions (and a deal value of about $9B), with a 25% growth rate compared to 2017.
“With no doubt Fintech shows to be the most thriving industry in terms of capital raised by startups, having attracted $12B in equity investments, i.e. 14% of the total capital raised in the Old Continent – commented Alessandro Promutico, CEO L’Atelier BNP Paribas Americas – Furthermore, it is one of the most steadily growing industries at global level in terms of number of new startups tracked year over year. This report shows very well how software is disintermediating traditional customer facing banking activities, from payments to KYC going through wealth management and consumer credit. It also highlights that banking attackers come mainly from IT&Software as well as from Retail and Consulting industries.”
 The gap between Europe and US remains huge but Europe is catching up. In Europe we have 350 fintechs cumulatively raising $5.1B, versus 600 companies (raising $9.6B) in the US. The gap was much larger only three years ago (3X).
“Looking at the growth patterns of capital, we tracked the equivalent of a 2-year delay between US and EU in Fintech – commented Marco Marinucci, CEO of Mind the Bridge.
Insurtech, another thriving sector, looks like a relatively newcomer when compared to Fintech.
“Between EU and US, we have 6 times more Fintech companies than Insurtech ones – added Marco Marinucci, CEO of Mind the Bridge – Fintech companies raised $5.8M per each $1M raised by their Insurtech counterparts. In terms of number of M&As, Insurtech registers 147 deals against 851 of Fintech, even though it’s becoming more and more relevant.”
The Fintech M&A scene is led, with no surprise, by US, with 559 Exits, a 4X ratio compared to the second in line, UK, dominating the European scene with 136 exits (46% of the total, a fact that and should raise some questions about the potential implications of a hard Brexit scenario). Germany ranks 3rd with only 30, France follows with 25, Spain is 8th with 13, Italy is only 12th with 8 deals. The Buy side (acquisitions) shows a similar ranking.


Among all the tracked deals, Payment is the most attractive vertical for buyers (17%), even if it seems to be slowing down after a three-year period of steady, exponential growth; Banking follows with 7%, confirming its centrality with a constant, linear growth rate; Cryptos-Blockchain (with 5% of total deals) is literally exploding (yet with the turbulence of a sector still subject to regulatory issues, potential scams, and complications). Other relevant technologies are Credit Management (4%), Crowdfunding, Billing, Personal Finance, Crowdsourcing, Asset Management (3% each), Trading Platforms, PoS, Security (2% each), Lending and Risk Management (1% each, where Risk Management crosses the line between Fintech and Insurtech).
Buyers of Fintech Technology come mostly from the Finance&Banking sector (56%), currently facing a high risk of disruption and erosion of margins. 18% is managed by IT&Software companies , 7% by Business Services&Consulting. Consumer&Retails gets the 4%.
DNA of an Acquired Fintech Company – Not considering outliers, at the time of acquisition the typical acquired Fintech company has 105 employees on average (larger than the average for other verticals, 50-100). It’s usually 7.7 years old, relatively younger than the most acquired startups (9 year old on average). At the time of the transaction, it has raised on average $14.9M in capital. Average price ticket is $160.9M, that means an average 10X multiple on capital invested.
“What’s the fair price to be paid? This is the one million dollar question a company asks itself (and often us) at the time of an acquisition – commented Alberto Onetti, Chairman Mind the Bridge – This is why in this Report we included a session with Multiples and Metrics. Startups are most of the times pre-revenue and, also when they have revenue, this is a bad proxy because the market potential is still ahead of them. Also, looking at capital raised doesn’t help because there’s no direct correlation between it and the performance of the company.”
Revenue Multiple (price paid vs last year revenue)
Median multiple in fintech shows to be 3.4 of the trailing revenue (last fiscal year).
The larger the revenue, the higher the multiple. Companies with revenues between $50M and $200M show the highest multiples (4X). With over $200M in revenues, the multiple goes slightly down (3.3X). Below $50M, the revenue multiple is approximately 3X on average
Capital Raised Multiple (price paid vs. overall capital raised since inception)
The average price multiple shows to be 3 per each million of capital raised.
Smaller startups ($0-20M raised) generate relatively lower multiples (2.4x on average), while large companies ($20-100M in capital raised) are paid more (3.3x on average)
Average Price Paid per Employee (price paid vs. number of employees)
On average, fintech companies are paid $0.8M per is employee. This indicator is particularly relevant for acqui-hires. For startups until 50 employees, the price paid is $1.1M per head.

People need time to try a product in order to appreciate it. Despite the fact that digital products often see faster results, they are still subject to the market rules. This means that success depends not only on the product but also on how and when it is introduced to the market, what support is provided to users, what is offered by competitors, on what terms service operates and many other business factors.